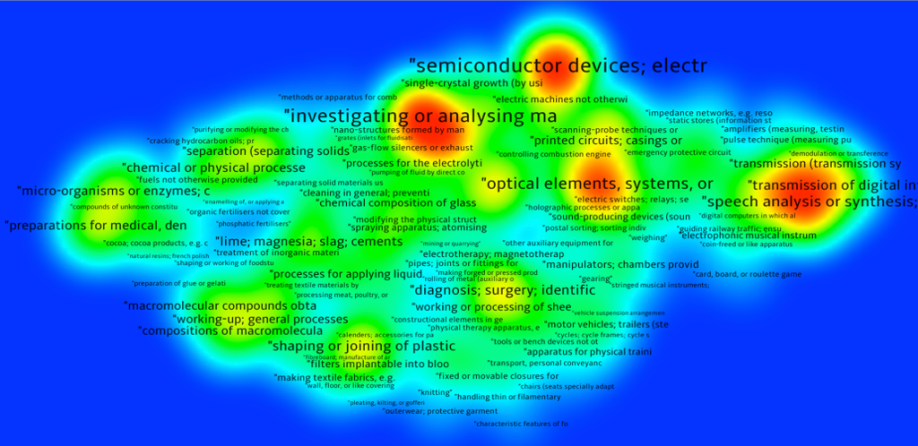
This image is a map of the patent portfolio of the Fraunhofer Institute.
The map represents technology space mapped using citation relationships, following an approach pioneered by the Dutch information scientist Loet Leydesdorff: Biology and chemistry is on the left side, optics and electronics on the right, and construction near the bottom. Fields that cite each other more frequently are physically closer to each other, so looking at the map gives the reader a sense of what fields a group has patented most in, and also what nearby fields might reasonably use this technology. The text represents the field as defined by an “IPC” code; the larger the text, the more dominant that field in the portfolio.
The map can be used to communicate about a portfolio internally, or to help scope out potential partnership opportunities. For example, with a patent portfolio as large as Fraunhofer’s, it’s hard to understand where to begin a search for out-licensing opportunities. By looking at the map, it’s immediately clear that they have a large body of IP in semiconductors, materials analysis, and speech recognition; these represent the most fertile grounds for IP out-licensing. But areas of less concentration, such as surgery, still provide significant opportunity, even if they are less dominant.
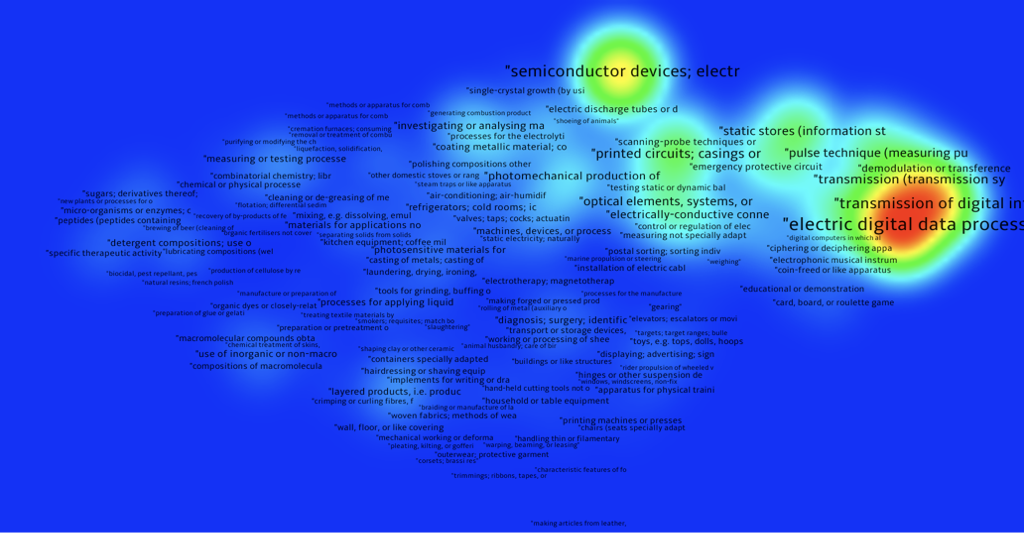
These maps keep their relative orientation no matter the company, so direct comparisons between organizations can be made. For example, a patent map for Intel is rather more focused than the one for Fraunhofer.
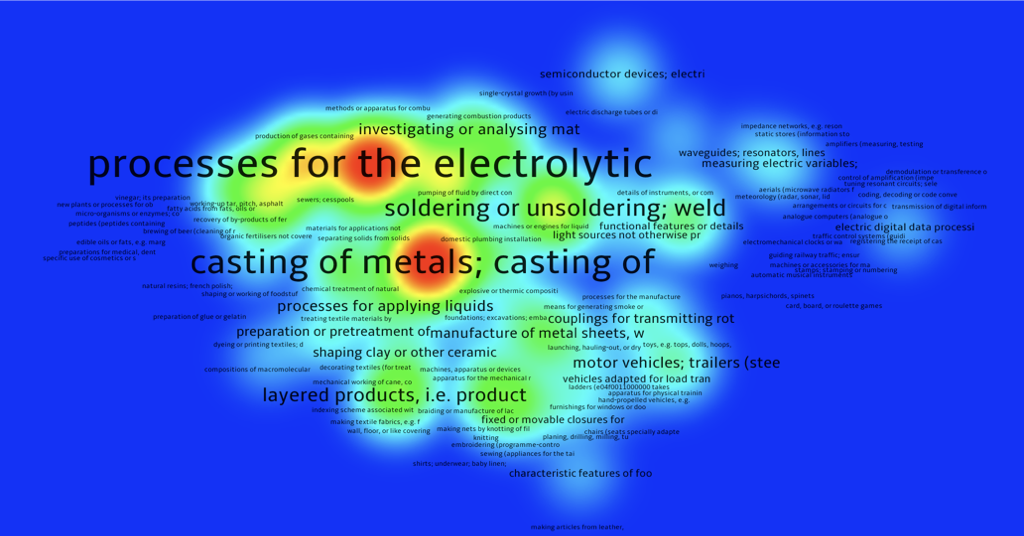
Whereas the patent map for the former Alcoa (prior to their 2016 split) is spread out over several areas, reflecting both refining operations and patents covering specific applications for aluminum, such as motor vehicles.
We can take these maps and look for areas of commonality. For example, Fraunhofer and Alcoa both have moderate programs in soldering, as indicated by the red in the map below.
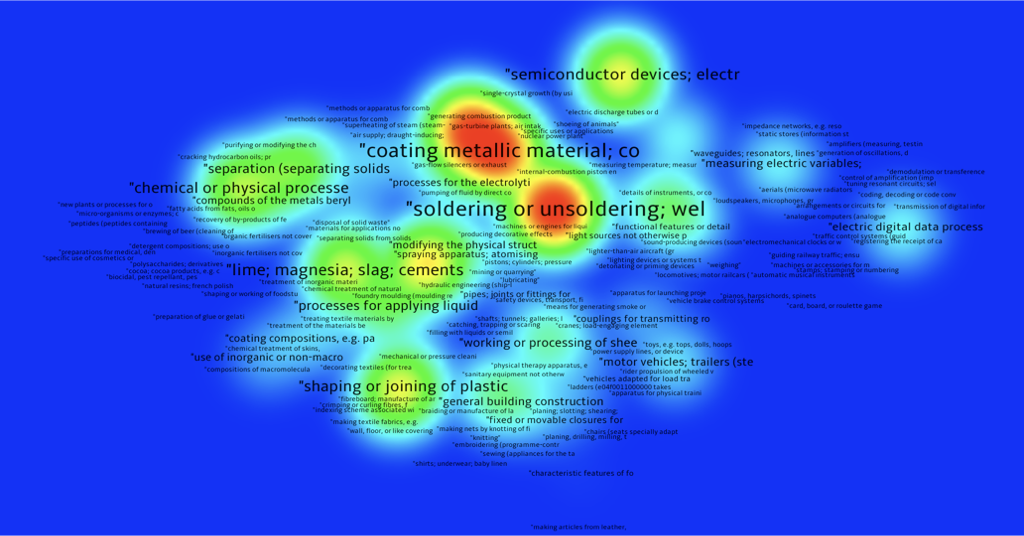
Neither of these programs are dominant at either institution (there is no red in this region for either Alcoa or Fraunhofer alone). But using this visual analysis it’s immediately evident that soldering is a competency for both, and may hold opportunities for collaboration.
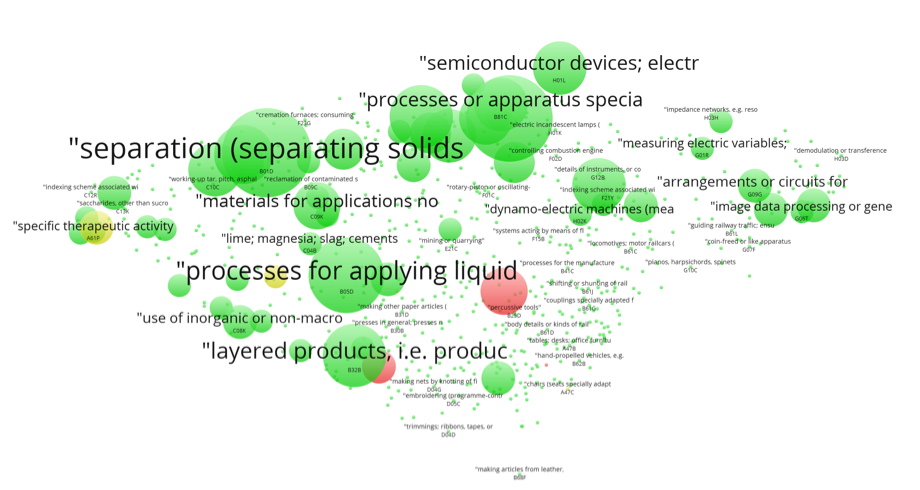
These types of maps can be made for any patent portfolio. Below is a similar map made for the inventions of Dr. Miller. Instead of a heat map as above, this map shows circles for each IPC code referenced in his 75+ patent portfolio. filtered by family, to avoid over-emphasizing inventions that have received more than one patent award. It shows a focus in chemistry, in particular coating processes (“applying liquid” and “layered”) and chemical separations. But it also has significant bubbles in semiconductors, optics, and biomedical regions. However, it’s clearly weak in railways and musical instruments, among others; there is only so much patent space one person can cover.
These maps are interactive, and can be zoomed and panned to identify high level technical details, see full titles, or avoid clashing labels. Ask us how they can be applied in your work!